Servicenow - Interactive Filter and it's uses in Dashboard
Development / Customization of Dashboard with Interactive Filters
Dashboard and Interactive Filters
This blog describes how we can create the dashboard, add
reports on it and add the OOTB Interactive Filters on the it along with custom
Interactive filter.
Dashboard with Interactive Filters
Development / Customization
of Dashboard and Interactive Filters
Author – Ganesh Chindhalore.
Wednesday, November 22, 2023
Contents
Dashboard and Interactive Filters
Create And Add custom
interactive Filter.
Create Custom Interactive
Filter
Add Custom Interactive
Filter to the dashboard.
Dashboard and Interactive Filters
This document describes how we can create the dashboard, add
reports on it and add the OOTB Interactive Filters on the it along with custom
Interactive filter.
Create Dashboard
Login to servicenow instance and search for the – Dashboards

Click on Dashboard under
Performance Analytics
It will open up the Dashboard
page as shown below
Now in order to create the
new dasboard , click on Create Dashboard button. PFB Screenshot FYR.

This will open new PA dashboard page as below. We need to
provide the Name of the dashboard which is only mandatory field.
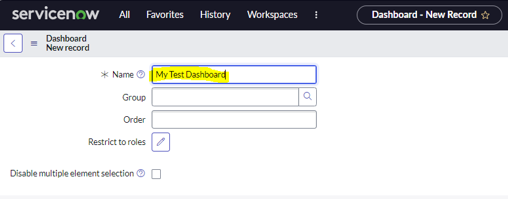
Submit the dashboard.
Now we can see that the dashboard is ready/created, and we
can add widget as per requirements.

Add Report to the Dashboard
We can create the report as per the requirement, this
document will not go deep into how we can create the report, instead this
document is more focusing on the development, customization of dashboard and
how we can add widget mainly reports and Interactive filter.
To add the report -
Click on ‘+’ sign to open Add widget window and from the
Widget category select ‘Report’ as shown below.

We have report created which will be listed in the report
list as shown and highlighted below.
We can optionally filter out the report and choose the
filtered report from the dropdown.
Select the report which want to add to the dashboard.

Once we select the report this will open the report and we
need to click on ‘Add’ button as shown in the below screenshot.

This will add the report in the screen as below, we can
adjust as per our requirements.

Now we want to add a second report to the dashboard.

Click on the add button, this will add the report on top of
the existing report.


Since, we want first report on top we can adjust the report
in the UI per requirements.

In this way we can add multiple report and adjust as per the
requirements.
Add OOTB Interactive Filter
ServiceNow provides some out of the box filter which we can
make use to filter the results of report in the dashboard.
Click on ‘+’ sign to open Add widget window and from the
Widget category select ‘Interactive Filter’ as shown below.

We have multiple options to add Interactive filter of Type.
Example, Filter cab be Checklist, Boolean, Date range,
Reference.
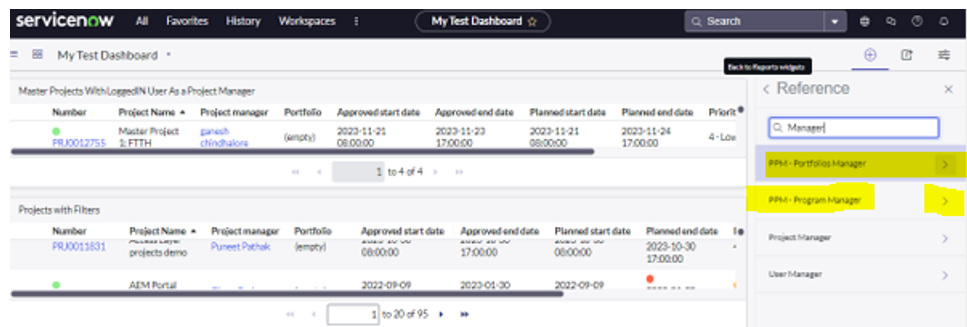
Here we will make use of the Reference Interactive Filter.
Click on the Reference as shown in the above screenshot.
This will open a list of all reference interactive filters available in the
instance. Here in this case, we are looking for the ‘Manager’ hence we typed
‘Manager’ to filter out the result in the list.

Note – ‘Project Manager’ Interactive filter listed is the
custom interactive filter in this list. This we will cover in the custom
interactive filter section of this document.
Now, We want to add
both
‘PPM Program Manager’
And
‘PPM Portfolio Manager’
filter in the
dashboard

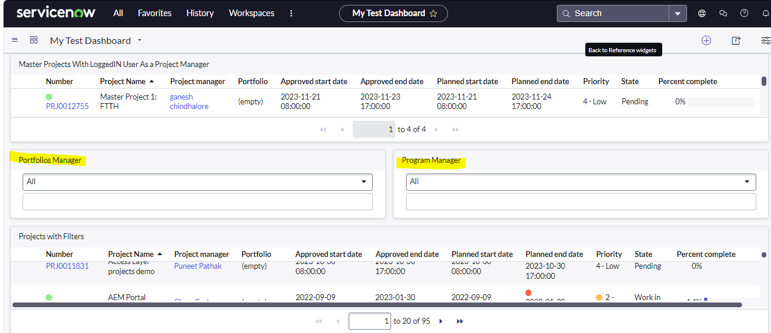
PPM Portffolio Manager Filter
added to the Dashboard. Now , Repeat this for PPM Program manager.


Both the filter now added and
we have adjusted the reports and Interactive filter as below.
Create And Add custom interactive Filter.
In this section, We will be covering how we can create and
add custom Interactive to the dashboard.
Create Custom Interactive Filter
Login to the servicenow instance and search for Interactive
Filter in the navigation.
Under Report section you can see the Interactive Filter.
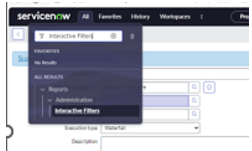
Click on it, it will open up list view. Click on Create.

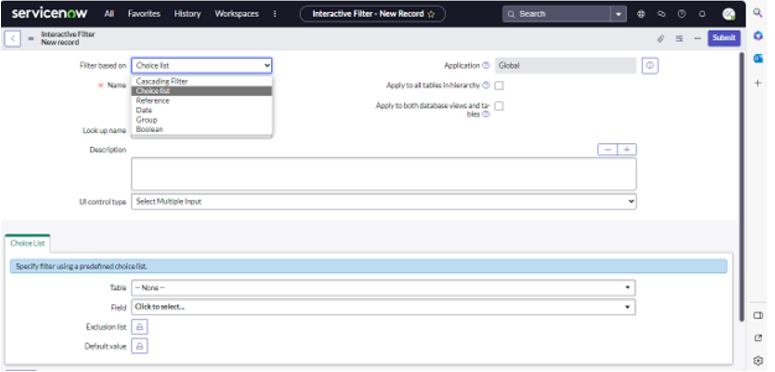
Provide Name, Description and Lookup Name.
Since, This is Reference filter we need to provide the
reference table name from where we need the data.
In this case we want o know the all the user who is Active.


Now we need to add the reference as below.
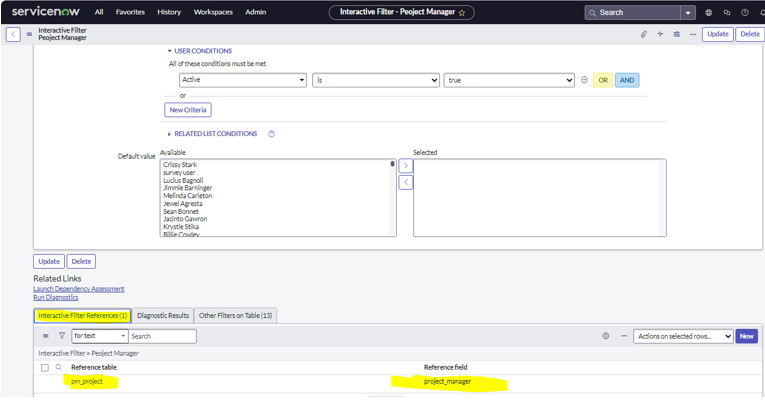
This means all the active users in ‘sys_user’ which is
reference to the project Manager in ‘pm_project’ table.
In this way we have created the custom Interactive filter
with the name ‘Project Manager’.
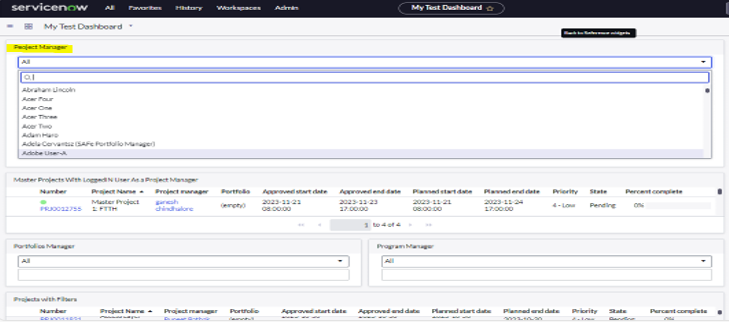
Add Custom Interactive Filter to the dashboard.
Now we can add the custom reference interactive filter to
the dashboard.

Click on the ‘Project Manager’

Add the filter to the
dashboard. We can see the Project Manager Interactive filter added
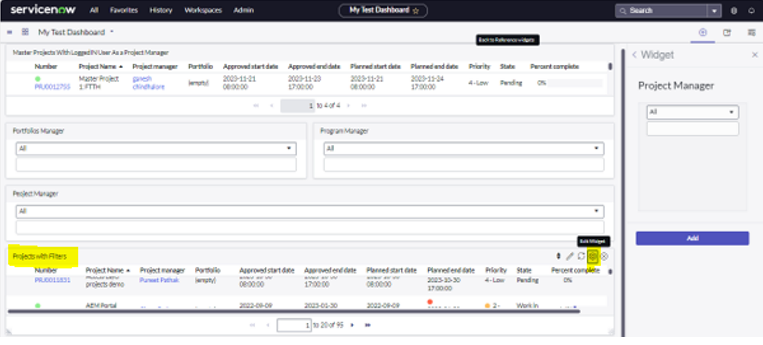
Adjust the Filter in the dashboard.

Follow Interactive Filter
Now it’s our choice which report should follow, the
Interactive Filter and which not.
Now we want the ‘Project with Filter’ Report to follow the
Interactive Filter.
Go To Edit widget (Report) and click on edit report Gear
icon, to open the setting.
This will open the setting as below, where we need to check
for ‘Follow Interactive Filter’ checkbox.

Now, you can filter out based on the Interactive Filter
available on the dashboard.
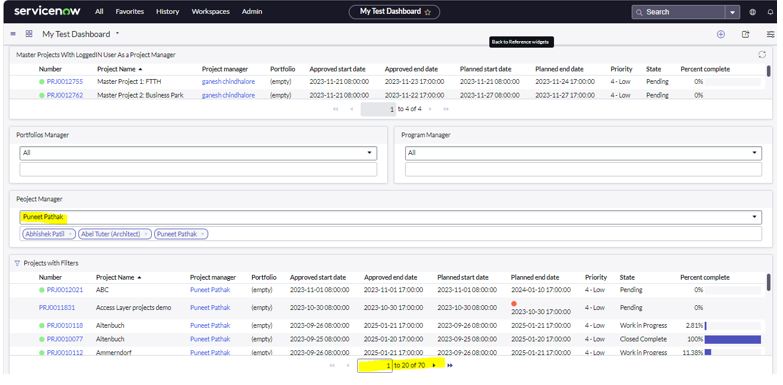
Here, We have filtered for ‘Abhishek’,’Puneet’ and ‘Abel’
Since this is multiselect we can select multiple Manager as
filter qualifications.
PFB.
Earlier the count was 95 and now it is filtered based on the
filter and count you can see reduced to 70.

Whereas we can see the first report which is there in the
top of dashboard is unchanged, since this is not following the interactive
filters.
Cascading Interactive Filters


Comments
Post a Comment